Fichier:Targzip.svg

Taille de cet aperçu PNG pour ce fichier SVG : 800 × 207 pixels. Autres résolutions : 320 × 83 pixels | 640 × 165 pixels | 1 024 × 265 pixels | 1 280 × 331 pixels | 2 560 × 662 pixels | 1 814 × 469 pixels.
Fichier d’origine (Fichier SVG, nominalement de 1 814 × 469 pixels, taille : 6 kio)
| Ce fichier et sa description proviennent de Wikimedia Commons. | Accéder au fichier sur Commons |
Description
| Description |
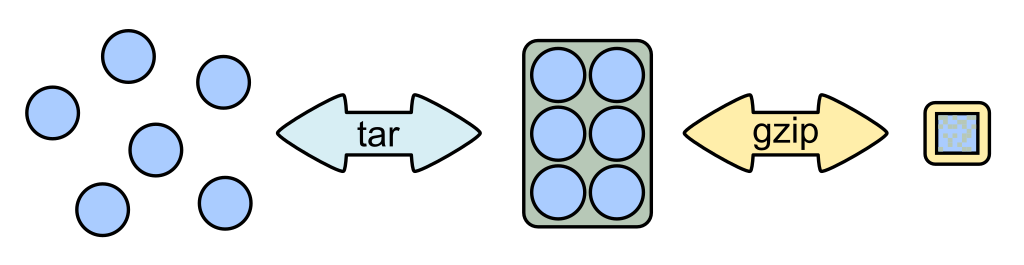
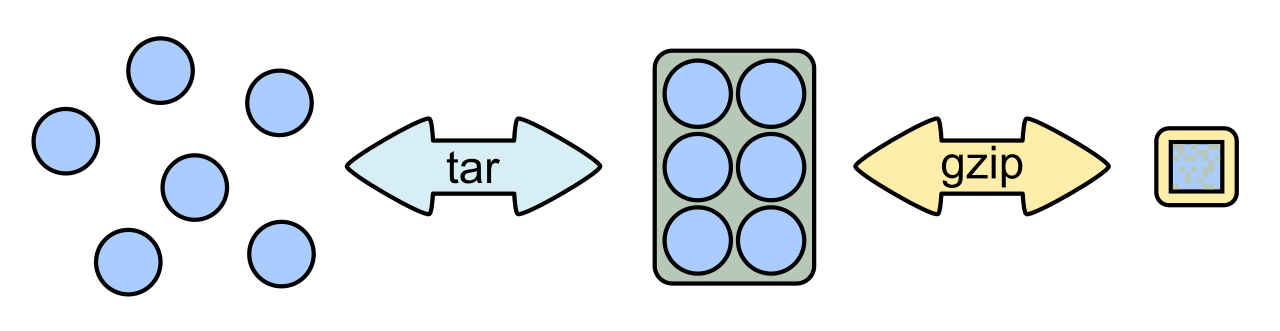
English: Schema of tar-creation and compressing via gzip. In this diagram, the entropy of data corresponds with how much of the data can fit in a square of the same width and height: the more that can fit, the more it has been compressed and the higher the entropy. The files are represented as circles and the gzip stream is represented as a square to show the change in entropy.
The tar container data occupies space equal to the area of the green rectangle (shown in the middle), and the file data occupies space equal to the area to the blue circles. Mathematically, they are in a ratio approximately 25:39, respectively. 64 blocks are shown in the gzip stream: the 25 green blocks are compressed tar container data and the 39 blue blocks are compressed file data. In real-world situations, certain data would be difficult to compress, such as a JPG image, and in the gzip stream, it would consume several times more data than the tar container data as tar data is relatively simple to compress. Other types of data, such as those with unusually long run-lengths, might be easier to compress than tar data.
Esperanto: Skemo de kunigo de dosieroj per tar kaj densigo de la arkivo per gzip
|
| Date | 03.07.2008 |
| Source | Travail personnel |
| Auteur | Th0msn80 |
| Autres versions | Image:Targzip.jpg |
Conditions d’utilisation
Moi, en tant que détenteur des droits d’auteur sur cette œuvre, je la publie sous la licence suivante :
Ce fichier est disponible selon les termes de la licence Creative Commons Attribution 3.0 Non transposée.
- Vous êtes libre :
- de partager – de copier, distribuer et transmettre cette œuvre
- d’adapter – de modifier cette œuvre
- Sous les conditions suivantes :
- paternité – Vous devez donner les informations appropriées concernant l'auteur, fournir un lien vers la licence et indiquer si des modifications ont été faites. Vous pouvez faire cela par tout moyen raisonnable, mais en aucune façon suggérant que l’auteur vous soutient ou approuve l’utilisation que vous en faites.
Historique du fichier
Cliquer sur une date et heure pour voir le fichier tel qu'il était à ce moment-là.
| Date et heure | Vignette | Dimensions | Utilisateur | Commentaire | |
|---|---|---|---|---|---|
| actuel | 27 août 2023 à 19:53 | 1 814 × 469 (6 kio) | Phreneticc | little compressed | |
| 27 septembre 2010 à 18:37 | 1 814 × 469 (19 kio) | Iago4096 | Made the writing slightly smaller so that it does not clash with the lines in the arrows | ||
| 4 août 2010 à 08:06 | 1 814 × 469 (17 kio) | X-Fi6 | After looking over the diagram, I decided it would be more accurate and make more sense if I made these changes. The ratio of compressed tar blocks to compressed data blocks (25:39) in the gzip stream is the same ratio as uncompressed tar data to uncompr | ||
| 4 août 2010 à 04:26 | 1 814 × 469 (13 kio) | X-Fi6 | Made one final update: changed blue square to yellow to indicate that it is gzip data and requires decompressing. | ||
| 4 août 2010 à 04:09 | 1 814 × 469 (13 kio) | X-Fi6 | Added blue square data in the gzipped tar archive | ||
| 3 juillet 2008 à 12:51 | 1 814 × 469 (18 kio) | Th0msn80 | {{Information |Description={{en|1=Schema of tar-creation and compressing via gzip}} |Source=Own work by uploader |Author=Th0msn80 |Date=03.07.2008 |Permission= |other_versions=Bild:Targzip.jpg }} {{ImageUpload|full}} |
Utilisation du fichier
Les 3 pages suivantes utilisent ce fichier :
Usage global du fichier
Les autres wikis suivants utilisent ce fichier :
- Utilisation sur de.wikipedia.org
- Utilisation sur en.wikipedia.org
- Utilisation sur fr.wikipedia.org
- Utilisation sur id.wikipedia.org
- Utilisation sur ja.wikipedia.org
- Utilisation sur ko.wikipedia.org
- Utilisation sur ru.wikipedia.org
- Utilisation sur uk.wikipedia.org
- Utilisation sur zh.wikipedia.org